 nicolanoe.it Un sito dedicato agli spazi verdi e all'ambiente – A site dedicated to green spaces and the Environment


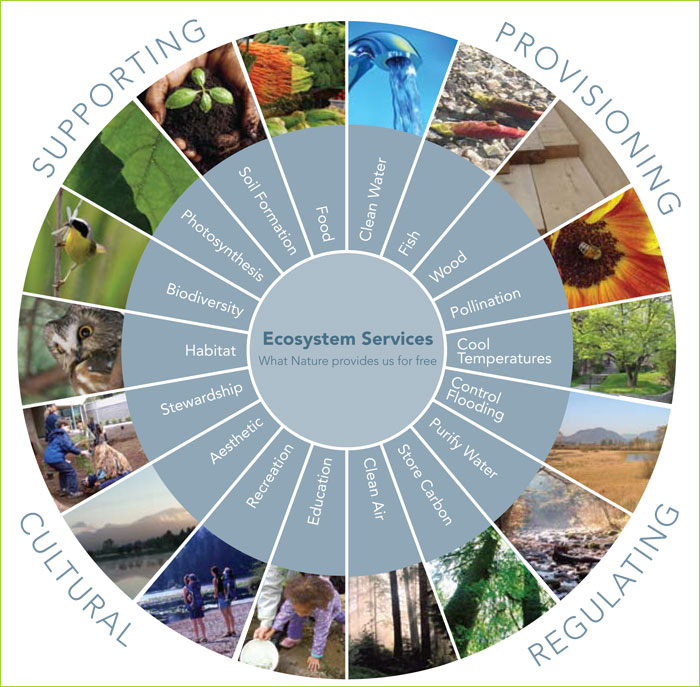
Ecosystem services have been defined by the Millennium Ecosystem Assessment (M.E.A. 2005) as ‘the multiple benefits that ecosystems provide to humanity’ and can be grouped into four main categories.
Supply services
Supply services are the goods obtained directly from ecosystems and include a wide range of consumer goods, such as food, wood, fossil energy resources, fresh water, natural chemical compounds and genetic material.
▪ Energy services: these were calculated in terms of biomass that can be produced for energy purposes. For the less natural types, estimates were used that enhance the role of urban greenery in reducing energy consumption by shading structures and contributing to the reduction of energy consumption for thermoregulation.
▪ Food production and wood: consists of agricultural products, pasture and undergrowth products such as small fruits and mushrooms, and wood production (i.e. the value of extractable wood assortments).
Life support services
These are habitat (or support) services, i.e. services that are essential to ensure others, such as different habitats for species and the maintenance of genetic diversity. Regulatory services include climate and tidal regulation, water purification, pollination and pest control.
Regulatory services
Regulatory services (of atmospheric gases, climate, water, erosion, prevention of hydrogeological disruption) are manifested through the regulation of the functioning of physical, ecological and biological processes that are fundamental to the integrity and functioning of ecosystems.
▪ CO2 uptake. Plants reduce CO2 in the atmosphere through chlorophyll photosynthesis, thus contributing to the mitigation of the greenhouse effect and heat islands. The value of this function was estimated by multiplying the amount of CO2 (determined by the different plant formations) by the value of one tonne of CO2.
▪ Disaster reduction, soil protection and hydraulic function. An attempt was made to assess the importance of vegetation formations for drinking water supply, soil conservation and protection against landslides and flooding.
Socio-cultural services
Ecosystems provide intangible services such as spiritual and cultural enrichment, psycho-emotional well-being, sense of identity and recreational services.
▪ Landscape/aesthetic services. The presence, density and extent of natural elements enhance the quality of the landscape in purely visual-aesthetic, identity, cultural, ecological and functional terms.
▪ Tourism and recreational services. These include the capacity of the vegetation to attract tourists or to enhance the tourist product.
Environmental mitigation role of tree lines in cities
Kianmehr et. al. (2024) report that according to the Intergovernmental Panel on Climate Change (IPCC), global surface temperatures are projected to increase between 0.3 and 4.8°C by the end of this century under various global warming scenarios. The impacts of a warming climate in cities will be particularly pronounced due to increased urbanisation, prevalence of impermeable surfaces and reduced vegetation cover (Dibaba, 2023, Dutta et al., 2021, Stone and Rodgers, 2001). In addition to the increased vulnerability of urban areas, they also face increased exposure to rising temperatures due to the increasing size of cities (Chakraborty et al., 2019; L. Hu et al., 2019). It is estimated that by mid-century, 68% of the world’s population will live in urban areas. The impacts of climate change, particularly rising temperatures, pose significant threats to human health and well-being (Lawrance et al., 2021), create economic burdens and exacerbate existing social conditions. inequalities (Islam and Winkel, 2017).
Again, Kianmehr et. al. (2024) indicate that a common measure to mitigate the impacts of rising temperatures, which has been shown to be effective in cooling surfaces and ambient temperatures in cities, is increasing the amount of vegetation, especially in the form of urban trees (Ellison et al., 2017, Iungman et al., 2023). Trees also contribute to reducing air pollution (Nowak et al., 2018), stormwater management (Selbig et al., 2022), providing opportunities for recreation and exercise (Jones, 2021), mitigating noise (Salmond et al., 2016), masking unwanted views and improving aesthetics (T. Hu et al., 2022). These benefits can improve public health and well-being, promote resilience and climate adaptation, and, if tree planting initiatives consider instances of equity, alleviate the burden of environmental inequalities (Chiabai et al., 2018, Nesbitt et al., 2018).
Most important ecosystem services associated with leaf area in the urban environment

In the city, trees and plants more generally shelter us from the scorching sun, beautify our neighbourhoods, help reduce noise and support wildlife in cities. In addition to these benefits that are difficult to monetise, trees, shrubs, herbaceous plants and green spaces as a whole provide additional services that can be estimated and constitute a concrete return on investment compared to the cost of planting and care. In addition, trees, shrubs and herbaceous plants in the urban environment, as providers of services to the community, should be counted as capital assets in the same way as roads, sewers, bridges and public buildings.
The determination of the value of ecosystem services provided by plants in the urban environment is estimated on the basis of species-specific characteristics and the extent of leaf area. The value of the environmental performance of a plant in an urban environment thus varies, in total, from a few tens to several hundreds per year.
To evaluate the ecosystem services associated with leaf area extension, we can consider rainwater interception, energy saving, air pollution reduction and CO2 reduction of trees. The value of each ecosystem function was determined by comparing the costs of managing the same environment with and without trees (Noe, 2019).
Interception of rainwater
Ecosystems help stabilise hydrological cycles and recharge aquifers by stopping soil erosion, reducing the effect of precipitation on the soil and regulating the flow of water in streams and rivers. A well-developed plant is able to reduce both the amount of runoff and the amount of pollutants in the receiving waters (see the following section ‘Abatement of air pollutants’). The calculation of the interception benefit must consider the slowing down of the flow of water that reaches the soil and the amount of water that does not reach the soil because it evaporates on contact with the canopy. The combined result of these two phenomena is that runoff volumes are reduced and peak runoff is delayed. Determining the leaf surface area of plants makes it possible to calculate the volume of meteoric water intercepted by the canopy before reaching the soil and thus provides the basis for all runoff calculations and, ultimately, for savings in adaptation and maintenance of the drainage system.
A case study: New York City (https://tree-map.nycgovparks.org/)
The city of NYC indicates the economic value of rainwater interception for each tree, using experimental data available in the literature (USDA Forest Service’s i-Tree). It is observed that the amount of stormwater intercepted per year calculated for NYC trees ranges from 50 to 310 l/cm trunk diameter. Large trees can therefore intercept up to 30 m3 of stormwater per year. The unit value of the rainwater interception benefit, which results in a decrease in urban runoff, is estimated at $2.4/m3 of water. An interception benefit of 20-30 €/year is therefore calculated for a medium-sized tree, up to 70 $/year and more for a large tree. The quantification of this saving is calculated as a decrease in the annual maintenance costs of the sewerage network due to the reduction in peak runoff and the structural cost of replacing and renovating the sewerage network to adapt it to the increase in peak runoff caused by climate change (increasingly extreme weather phenomena).
Removal of air pollution

Plants absorb pollutants such as carbon monoxide (CO), sulphur dioxide (SO2), nitrogen oxides (NOx), ozone (O3) and particulate matter (PM) from the atmosphere, thus improving air quality through both photosynthesis (O2 emission) and the absorption and adsorption of air pollutants. Ecosystems act as natural filters, trapping pollutants on leaves and surfaces, which are then washed away by rain or deposited in the soil. This purifying effect helps reduce respiratory disorders and other health problems associated with air pollution, benefiting both humans and wildlife. Determining the leaf area of trees allows the interception area of pollutants both in the atmosphere and dissolved in rainwater to be calculated, providing the basis for pollutant abatement calculations. Trees also preserve water quality by reducing runoff during light rainfall, which is responsible for the leaching of most pollutants. Runoff from man-made environments is a major cause of pollutant inputs to wetlands, rivers, lakes and oceans.
A case study: New York City (https://tree-map.nycgovparks.org/)
The city of NYC indicates the economic value of air pollutant abatement per tree, using experimental data available in the literature (USDA Forest Service’s i-Tree). It is observed that, depending on tree size and species, the weight value (kg) of air pollutants abated varies from a few grams to 2 kg/year and more. The abatement value of air pollutants is estimated to average $1.20/kg of air pollutants. A single large tree avoids air pollutant removal costs of $30/year.
Lowering the air temperature (energy saving)
Urban green spaces and vegetated areas help reduce the urban heat island by providing shade and evapotranspiration cooling. Trees planted strategically around buildings can reduce the need for air conditioning in hot weather, thus reducing energy consumption. Trees, shrubs and herbaceous plants reduce air conditioning energy consumption by lowering summer temperatures. A further and consequent contribution to energy savings is the reduction of water consumption and pollutant production by power plants.
A case study: New York City (https://tree-map.nycgovparks.org/)
The city of NYC indicates the economic value of energy savings for air conditioning per tree, using experimental data available in the bibliography (USDA Forest Service’s i-Tree). It is noted that, depending on tree size and species, energy savings for cooling urban environments of up to 2-3,000 kWh per year have been estimated for large street trees. Assuming that the kWh value is much lower in the US, it is estimated that a large tree reduces air conditioning costs in an urban environment by more than $300/year.
How Milan Street Trees (MST) Influence Shade and Temperature
Fixation of CO2
Ecosystems are vital in the global carbon cycle because they absorb and store carbon dioxide through the process of photosynthesis. Plants use CO2 in the atmosphere to produce organic matter, which is stored in vegetation as organic carbon. Therefore, the ecosystem contributes to climate regulation by maintaining the carbon dioxide balance.
Urban forests reduce CO2 in two ways:
– they sequester CO2 directly in growing leaves and shoots.
– in the vicinity of buildings they reduce energy demand for air conditioning, reducing emissions associated with energy production.
A case study: New York City (https://tree-map.nycgovparks.org/)
The city of NYC indicates the economic value of CO2 reduction for each tree using experimental data available in the literature (USDA Forest Service’s i-Tree). It is observed that the weight value of CO2 reduced by a large tree can be up to several tens of kilos per year (10-20 kg/year for trees in urban settings, up to 50 kg/year and more in parks). The value of the reduced CO2 is estimated at an average of 0.21 €/t. A large tree reduces CO2 by an estimated 60 €/year.
Calculation of leaf area-related ecosystem services
The methodology proposed in Digital Green Cadastre (Noe, 2019), which is suitable for estimating ecosystem services more closely related to the environmental mitigation of the effects of urbanisation, was used to assess the ecosystem services related to leaf area provided by tree rows in the city each year.
More information 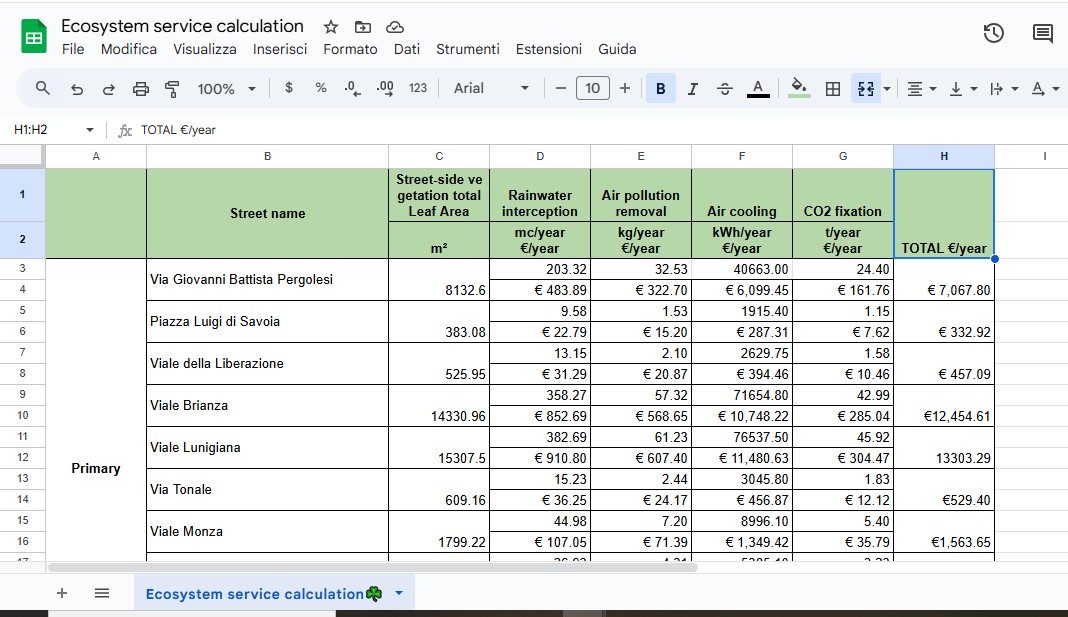 on http://www.catastodelverde.it/page17.html
Using data collected on http://www.urbanplan.it/urbanplan/gix_alberi_milano?u=1&p=milalb, the extent of canopy cover and consequently the amount of total leaf area of the tree line is measured, and thus its ability to mitigate the effects of air pollution, heat islands and stormwater runoff peak management.
▪ Cooling
▪ Reduction of air pollutants
▪ Rainfall interception
▪ CO2 fixation and subsequent release of O2 into the atmosphere
In order to increase the mitigation effects of vegetation, it is necessary to increase the leaf area, with particular attention to areas where the density of impermeable surfaces is higher.
Starting from the census of the tree-covered row, the total leaf area is calculated using the average leaf area index per type of green cover of lawns, shrubs and trees).
TABLE – Estimation of the leaf area of the vegetation present on a hypothetical tree row using the average Leaf Area Index.
| Projected canopy surface (m2) | Average LAI | Total LA (m2) | |||
| Lawn and/or ground cover | 100,00 | 1,50 | 150,00 | ||
| Trees and/or shrubs | 1.000,00 | 4,00 | 4.000,00 | ||
| TOTALE | 4.150,00 | ||||
| (LA Leaf Area, LAI Leaf Area Index) | |||||
As indicated in the previous paragraphs, for an estimate of the quantities of ecosystem services provided by the plant heritage present in public green areas we can apply average values of ecosystem services provided per unit of leaf area. Applying the same procedure, it is possible to estimate an average economic value of management cost savings for the Municipality per unit of leaf area (see table below).
TABLE – Quantity and value of some of the most important ecosystem services (ES) per unit of leaf area (LA) per year to mitigate micro-environmental impacts.
| ES per unit of LA | LA unit value | |
| Rainwater interception | 90 l/m2/year | 2,38 €/mc |
| Air pollution removal | 4 g/m2/year | 9,92 €/kg |
| Air cooling | 15 kWh/m2/year | 0,15 €/kWh |
| CO2 fixation | 0.8 kg/m2/year | 6,63 €/t |
| (LA Leaf Area, ES Ecosystem Services) | ||
The figure per unit leaf area is multiplied by the total leaf area of the observed row. The ‘total leaf area’ figure is continuously updated as the green census is updated. In fact, tree rows can improve in quality (type of vegetation cover) and in quantity (new trees and shrubs, depaving, etc.).
TABLE – Quantity and value of the main Ecosystem Services of micro-environmental mitigation of tree-lined vegetation per year.
| Total value per year | Equivalent in euro per year | |
| Rainwater interception | 373,50 mc | 888,93 € |
| Air pollution removal | 16,60 kg | 164,67 € |
| Air cooling | 62.250,00 kWh | 9.337,50 € |
| CO2 fixation | 3,32 t | 22,02 € |
| TOTAL | 10.413,11 € |
The objective is to estimate the mitigation activity of tree rows to demonstrate that for management costs they provide much greater community services and are indispensable, such as more breathable air and heat island mitigation.